

DataBuff
DataBuff is a self-hosted, AI-native application performance monitoring backend built on OpenTelemetry, with multi-agent troubleshooting that lets LLMs query live traces, metrics and topology directly.
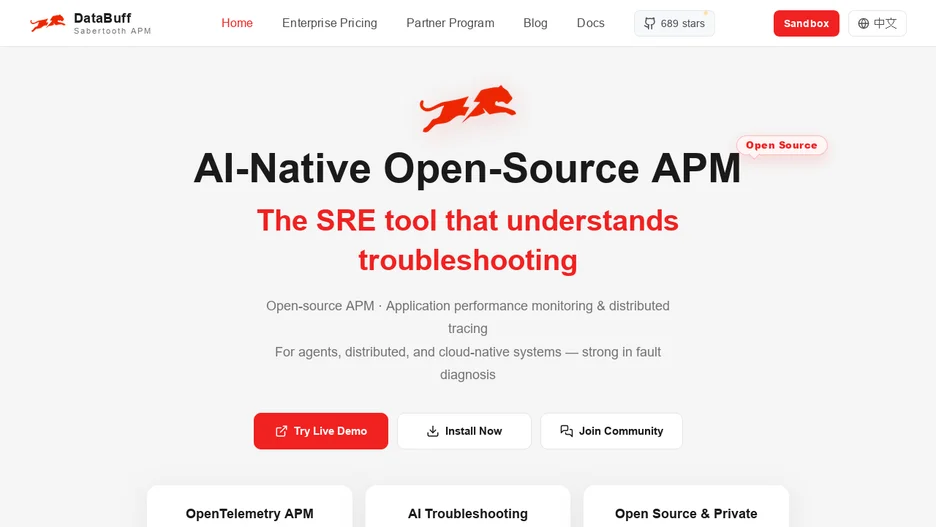
DataBuff is an APM backend that ingests traces, metrics and logs over OTLP and provides full-stack monitoring, service topology and RED metrics, aiming to be a complete OpenTelemetry-native APM backend rather than another observability UI layered on top of one. It is compatible with Apache SkyWalking for migration and is listed as an OpenTelemetry-native vendor and on the CNCF Landscape.
Its multi-agent AI Brain orchestrates query, inspection, operations and question-answering experts in parallel, so a user can go from a natural-language question to root-cause analysis without a separate AI platform; an API key for a model provider such as Kimi, DeepSeek, GLM or Ollama is added after installation. It exposes and consumes the Model Context Protocol (MCP), so it can expose its own capabilities to tools like Cursor or Claude, and ingest data from external MCP servers such as Prometheus.
It is written in Java, self-hosted, and deployed with a single Docker command running an ingest service, Doris and a web frontend.