

ForensicDbg
A post-mortem debugger for native Windows x86 and x64 crashes, with an MCP interface so AI tools can consume crash-dump analysis directly.
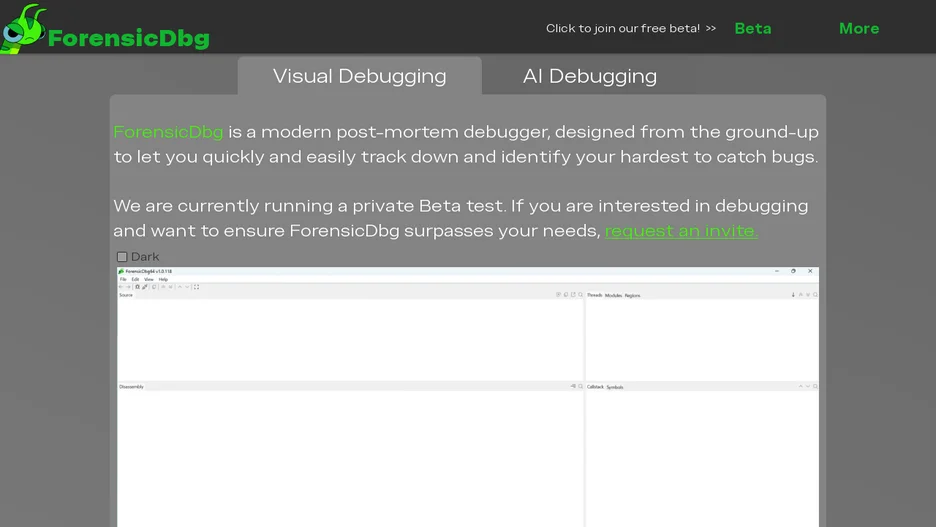
ForensicDbg is a post-mortem debugger for Windows built to track down hard-to-catch crashes. It debugs x86 and x64 crash dumps, can attach to live processes, and can be set as the system's just-in-time debugger so it opens automatically when a crash happens; it includes a simple C++ expression evaluator and supports SourceServer and SourceLink.
It deduces types from usage and references, tracks register values through disassembly, validates callstacks to remove misleading frames, simulates the image loader to reconstruct missing read-only regions in minidumps, and automatically selects the thread, frame, and instruction that caused the exception.
An MCP interface exposes crash analysis to AI tools directly, with output labeled and interpreted so a model spends less effort parsing raw data and produces better results at a lower token cost. It is currently in a private beta.