

Pinpoint
An application performance management tool that traces transactions across large, distributed Java, PHP and Python systems to map service topology and pinpoint bottlenecks.
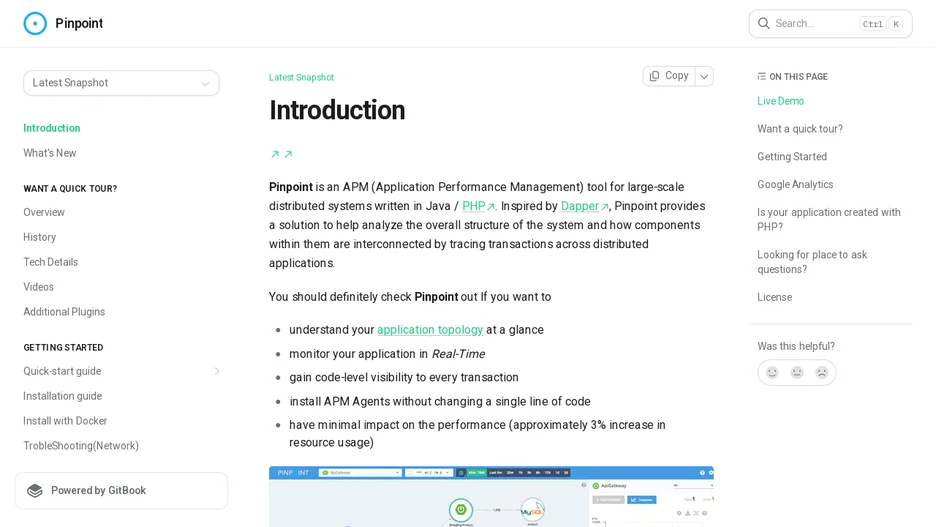
Pinpoint is an APM tool for large-scale distributed systems, inspired by Google's Dapper. It traces transactions as they cross services written in Java, PHP or Python, installing as agents that require no code changes and add roughly 3% resource overhead.
A ServerMap visualizes how components are interconnected and shows a node's status and transaction counts, a real-time active-thread chart monitors threads inside applications, and a request/response scatter chart highlights response-time patterns that can be selected for further detail. A CallStack view gives code-level visibility into a single transaction across the distributed system, and an Inspector view shows further per-application detail.
Pinpoint can also be deployed to Kubernetes.