

Flint
A visualization intermediate language that lets AI agents turn a compact, human-editable chart specification into a polished chart, compiling one input to Vega-Lite, ECharts, Chart.js, Plotly or native Excel output.
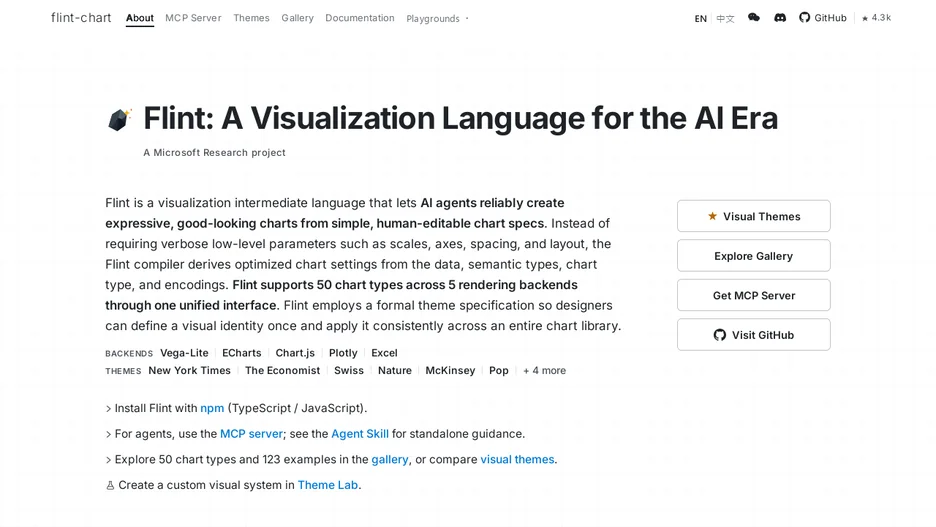
Flint is a visualization language that derives chart decisions, such as scales, axes, spacing, labels and layout, from a high-level semantic specification, the underlying data, and an optional visual theme such as New York Times, Economist, Swiss or McKinsey style, instead of requiring an agent to hardcode those parameters directly. It captures what each data field means using more than 70 semantic types, such as rank, temperature, price or country, and automatically adapts layout to data cardinality and canvas constraints.
The project has two main parts: flint-chart, a JavaScript and TypeScript library that compiles a Flint specification into Vega-Lite, ECharts, Chart.js, Plotly or Excel-native output, and flint-chart-mcp, an MCP server that lets an agent create, validate and render charts directly from a chat or coding environment, including a hosted server reachable from clients such as GitHub Copilot in VS Code or Claude's custom connectors.